What is ANOVA Test? Definition, Types, Examples
Appinio Research · 13.08.2024 · 30min read
Content
Have you ever wondered how researchers determine if different groups in a study have significantly different outcomes? Analysis of Variance, commonly known as ANOVA, is a statistical method that helps answer this crucial question. Whether comparing the effectiveness of various treatments, understanding the impact of different teaching methods, or evaluating marketing strategies, ANOVA is a powerful tool that allows us to compare the means of three or more groups to see if at least one is significantly different.
This guide will walk you through the fundamental concepts, mathematical foundations, types, and practical applications of ANOVA, ensuring you understand how to design experiments, check assumptions, perform analyses, and interpret results effectively. By the end, you'll see why ANOVA is a cornerstone of statistical analysis across numerous fields, providing a robust framework for making informed decisions based on data.
What is ANOVA?
ANOVA, or Analysis of Variance, is a statistical method used to compare the means of three or more groups to see if at least one of them is significantly different from the others. This technique helps to determine whether observed differences in sample means are due to actual differences in population means or merely the result of random variation.
Purpose of ANOVA
- Comparing Multiple Groups: ANOVA allows you to simultaneously compare the means of three or more independent groups. This is more efficient and informative than conducting multiple t-tests, which increases the risk of Type I error (false positives).
- Identifying Significant Differences: By testing for differences in group means, ANOVA helps to determine whether any of the groups are significantly different from each other. This is essential in experiments where treatments or interventions are compared.
- Partitioning Variance: ANOVA partitions the total variance observed in the data into variance between groups and variance within groups. This helps in understanding the sources of variability in the data.
- Evaluating Interactions: Two-way ANOVA can assess interactions between factors. This means you can see if the effect of one factor depends on the level of another factor.
- Guiding Further Analysis: When ANOVA shows significant differences, it often leads to further analysis, such as post-hoc tests, to identify which specific groups differ from each other.
Importance of ANOVA in Statistical Analysis
ANOVA is a cornerstone of statistical analysis in many fields, including psychology, medicine, agriculture, marketing, and education. Its importance lies in its versatility and robustness in comparing multiple groups and understanding complex data structures.
- Enhanced Accuracy: ANOVA controls for the Type I error rate better than multiple t-tests, providing more reliable results when comparing multiple groups.
- Comprehensive Analysis: It offers a systematic approach to understanding the variability in data by decomposing the total variance into meaningful components.
- Flexibility: ANOVA can handle different experimental designs, including one-way, two-way, and multivariate designs, making it adaptable to various research questions and data structures.
- Insight into Interactions: By assessing interactions between factors, ANOVA provides deeper insights into how different variables jointly affect the outcome.
- Foundation for Advanced Methods: ANOVA forms the basis for more complex statistical methods like MANOVA (Multivariate ANOVA), ANCOVA (Analysis of Covariance), and repeated measures ANOVA, which are essential for analyzing more complex data sets.
- Widespread Application: Its principles are widely applied across diverse disciplines, making it a fundamental tool for researchers and analysts aiming to draw meaningful conclusions from their data.
ANOVA Mathematical Foundations
ANOVA is grounded in several key mathematical concepts. A solid grasp of these foundations will deepen your understanding and enhance your ability to apply ANOVA effectively.
Understanding Variance and its Components
Variance measures how much the data points in a set differ from the mean of the set. It's crucial for ANOVA because the technique relies on partitioning this variance to understand differences between groups.
- Total Variance: The overall variability in the data.
- Between-Group Variance: The variability due to differences between the group means.
- Within-Group Variance: The variability within each group.
To illustrate, imagine you have test scores from three different classes. Total variance includes all score variations, but between-group variance focuses on differences between the classes' average scores, and within-group variance looks at the score spread within each class.
Formulae and Calculations
The core of ANOVA lies in calculating the F-ratio, which compares the variance between groups to the variance within groups.
ANOVA Calculation
- Calculate Group Means: Compute the mean for each group.
- Overall Mean: Calculate the mean of all data points combined.
X_total = (ΣX_i) / n - Sum of Squares Between (SSB): This measures the variation due to the interaction between the groups.
SSB = Σ (n_j * (X_j - X_total)^2)
Where n_j is the number of observations in group j, X_j is the mean of group j, and k is the number of groups. - Sum of Squares Within (SSW): This measures the variation within each group.
SSW = Σ Σ (X_ij - X_j)^2
Where X_ij is the observation i in group j. - Degrees of Freedom: Calculate the degrees of freedom for between groups (dfB) and within groups (dfW).
dfB = k - 1
dfW = N - k
Where N is the total number of observations. - Mean Squares: Compute the mean squares for between groups (MSB) and within groups (MSW).
MSB = SSB / dfB
MSW = SSW / dfW - F-Ratio: Finally, calculate the F-ratio.
F = MSB / MSW
The F-ratio tells you if the between-group variance is significantly greater than the within-group variance, indicating significant differences among group means.
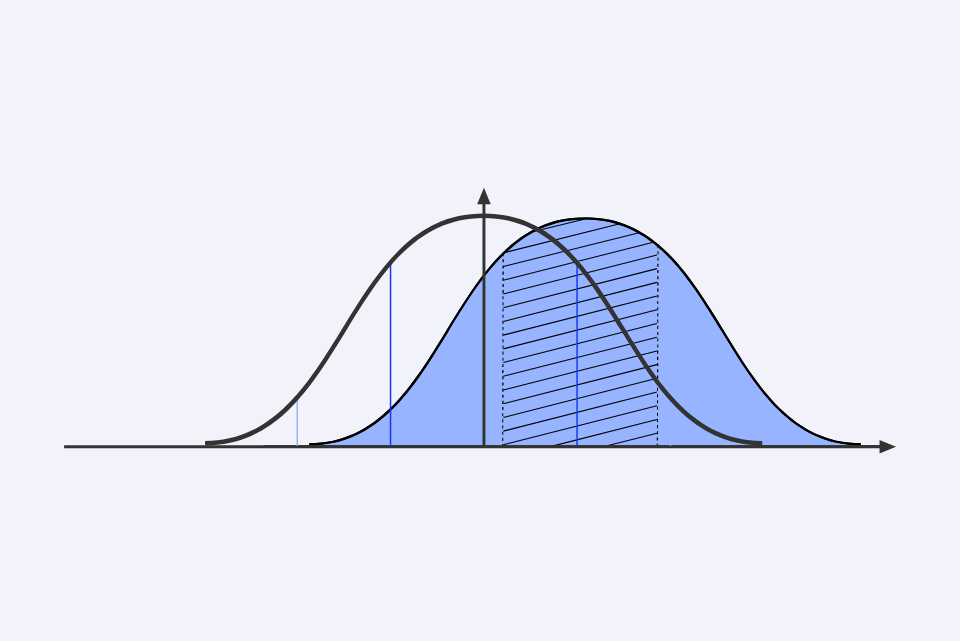
The F-Distribution
The F-distribution is essential for determining the statistical significance of your ANOVA results. It's a probability distribution that arises frequently when dealing with variances.
- Shape: The F-distribution is right-skewed and varies based on the degrees of freedom for the numerator (between groups) and the denominator (within groups).
- Critical Values: These are determined by the F-distribution and your chosen significance level (usually 0.05). If your calculated F-ratio exceeds the critical value, you reject the null hypothesis, concluding that significant differences exist among the group means.
To use the F-distribution, you typically refer to F-tables or use statistical software, which will provide the p-value associated with your F-ratio. This p-value helps in deciding whether to accept or reject the null hypothesis.
Understanding these mathematical foundations equips you to use ANOVA effectively, ensuring accurate and meaningful statistical analysis.
Types of ANOVA
ANOVA comes in various forms, each suited for different experimental designs and research questions. Understanding these types will help you choose the proper method for your analysis.
One-Way ANOVA
One-Way ANOVA is the simplest form of ANOVA, used when comparing the means of three or more independent groups based on one factor. It's advantageous when assessing whether there are any statistically significant differences between the means of independent (unrelated) groups.
One-Way ANOVA is used when there is a single independent variable with multiple levels and one dependent variable. For example, you might want to compare the test scores of students taught using three different teaching methods.
You can leverage our One-way ANOVA calculator to easily conduct this test.
Example Scenarios
Suppose you are investigating the effect of different fertilizers on plant growth. You have three types of fertilizers (A, B, and C), and you measure the growth of plants using each type.
One-Way ANOVA Calculation
- Calculate Group Means: Compute the mean for each fertilizer type.
- Overall Mean: Calculate the mean of all data points combined.
X_total = (ΣX_i) / n - Sum of Squares Between (SSB): This measures the variation due to the interaction between the groups.
SSB = Σ (n_j * (X_j - X_total)^2) - Sum of Squares Within (SSW): This measures the variation within each group.
SSW = Σ Σ (X_ij - X_j)^2 - Mean Squares: Compute the mean squares for between groups (MSB) and within groups (MSW).
MSB = SSB / dfB
MSW = SSW / dfW - F-Ratio: Calculate the F-ratio to determine if the variance between group means is significantly larger than the variance within the groups.
F = MSB / MSW
Two-Way ANOVA
Two-Way ANOVA extends the one-way ANOVA by incorporating two independent variables. This method allows you to examine the interaction between these variables and their individual effects on the dependent variable.
Two-Way ANOVA is used when you have two independent variables. For example, you might want to examine the effects of different diets and exercise regimes on weight loss.
Interaction Effects
Interaction effects occur when the impact of one independent variable on the dependent variable depends on the level of the other independent variable. Understanding these interactions can provide deeper insights into the data.
Two-Way ANOVA Calculation
- Calculate Group Means: Compute the mean for each combination of levels of the two factors.
- Sum of Squares: Compute the sum of squares for each main effect and the interaction effect.
SS_A = Σ n_ij * (X_A - X_total)^2
SS_B = Σ n_ij * (X_B - X_total)^2
SS_AB = Σ n_ij * (X_AB - X_total)^2 - Mean Squares: Compute the mean squares for each source of variation.
MS_A = SS_A / dfA
MS_B = SS_B / dfB
MS_AB = SS_AB / dfAB - F-Ratios: Calculate the F-ratios for each main effect and the interaction effect.
F_A = MS_A / MSW
F_B = MS_B / MSW
F_AB = MS_AB / MSW - Interpretation: Determine if the F-ratios are significant to understand the main and interaction effects.
MANOVA (Multivariate ANOVA)
MANOVA extends ANOVA by analyzing multiple dependent variables simultaneously. This method is useful when you need to understand the effect of independent variables on several outcomes.
MANOVA is used when you have more than one dependent variable. For example, you might want to study the impact of a training program on both employee performance and job satisfaction.
While ANOVA examines one dependent variable at a time, MANOVA assesses multiple dependent variables, accounting for their correlations and providing a more comprehensive analysis.
MANOVA Calculation
- Calculate Mean Vectors: Compute the mean vector for each group.
X_mean_vector = (X1_mean, X2_mean, ..., Xk_mean) - Covariance Matrices: Calculate the within-group and between-group covariance matrices.
W = Σ (X_i - X_mean) * (X_i - X_mean)^T
B = Σ n_j * (X_j - X_total)^2 - Multivariate Test Statistics: To evaluate the multivariate significance, use test statistics like Wilks' Lambda, Pillai's Trace, or Hotelling's Trace.
Wilks' Lambda = |W| / |W + B| - Significance Testing: Compare the test statistics to critical values from the multivariate F-distribution to determine significance.
Understanding these types of ANOVA and their applications will help you design better experiments and analyze data more effectively, providing deeper insights and more accurate conclusions.
ANOVA Assumptions and Preconditions
To ensure the validity of your ANOVA results, it's essential to understand and meet certain assumptions. These assumptions underpin the accuracy and reliability of the analysis.
Normality
Normality refers to the assumption that the data within each group follows a normal distribution. This assumption is crucial because ANOVA relies on the mean and variance of the data, and normality ensures that these statistics are reliable.
When the data are normally distributed, the statistical tests used in ANOVA are more accurate. This assumption is particularly important for smaller sample sizes, where deviations from normality can significantly impact the results.
Testing for Normality
Several methods can help you assess normality:
- Q-Q Plots: These plots compare your data's quantiles against a theoretical normal distribution. If the data points fall approximately along a straight line, the data are likely normal.
- Shapiro-Wilk Test: This statistical test checks for normality. A non-significant result (p > 0.05) suggests that the data do not significantly deviate from normality.
- Kolmogorov-Smirnov Test: Another test for normality, comparing the sample distribution with a normal distribution.
If your data deviates from normality, consider transforming the data (e.g., log transformation) or using non-parametric alternatives like the Kruskal-Wallis test.
Homogeneity of Variances
Homogeneity of variances, or homoscedasticity, means that the variances within each group are approximately equal. This assumption ensures that the comparison of means across groups is fair and accurate.
When variances are equal, the pooled estimate of the variance used in ANOVA calculations is accurate. Unequal variances can lead to biased results and incorrect conclusions.
Testing for Homogeneity
Several tests can check for homogeneity of variances:
- Levene's Test: This test assesses whether variances are equal across groups. A non-significant result (p > 0.05) indicates equal variances.
- Bartlett's Test: Another test for equal variances, more sensitive to departures from normality.
- Hartley's F-max Test: This test compares the largest and smallest variances among groups.
If variances are unequal, consider using a different version of ANOVA, such as Welch's ANOVA, which is more robust to heteroscedasticity.
Independence of Observations
Independence means that the observations within each group are not related to each other. This assumption ensures that the variance within groups reflects true individual differences rather than patterns or correlations.
Ensuring Independence
Independence is typically ensured through the study design:
- Randomization: Randomly assign subjects to groups to prevent bias.
- Blinding: Use single or double-blind designs to reduce biases that could correlate observations.
- Proper Sampling Techniques: Ensure that samples are drawn independently and represent the population accurately.
Violations of independence can severely affect ANOVA results, making them unreliable. If observations are not independent, consider using techniques like mixed-effects models that account for the lack of independence.
Checking Assumptions with Tests and Diagnostics
Before conducting ANOVA, verifying all assumptions are met is crucial. Here are some practical steps and tools:
Visual Diagnostics
- Box Plots: These plots can help you visualize the spread and identify potential outliers.
- Histograms: Assess the distribution of data within each group.
- Scatter Plots: Check for patterns that might suggest violations of independence.
Statistical Tests
- Shapiro-Wilk Test: Assess normality.
- Levene's Test: Check homogeneity of variances.
- Durbin-Watson Statistic: Evaluate independence in time-series data.
Software Tools
Statistical software packages (like SPSS, R, and Python libraries) offer built-in functions to perform these tests and generate diagnostic plots. For example:
- R: Functions like shapiro.test(), leveneTest(), and durbinWatsonTest() are available in various packages.
- SPSS: Offers point-and-click options to perform these tests.
- Python: Libraries such as scipy.stats and statsmodels provide functions for these diagnostics.
Ensuring that these assumptions are met is critical for the validity of ANOVA results. By rigorously checking assumptions, you can trust that your analysis is both accurate and reliable.
How to Conduct an ANOVA Test?
Conducting ANOVA involves several well-defined steps, from designing your experiment to interpreting the results. Here's a detailed guide to help you navigate this process effectively.
1. Designing an Experiment
A well-designed experiment is the foundation of a successful ANOVA. Start by clearly defining your research question and identifying your independent and dependent variables. Determine the number of levels for your independent variable(s) and ensure you have a sufficient sample size to detect meaningful differences.
Randomization is crucial to eliminate bias and ensure that the groups are comparable. Consider assigning subjects to different treatment groups using random assignment. If possible, incorporate blinding methods to reduce any potential influence of expectations on the outcomes.
2. Data Collection and Preparation
Accurate data collection is vital. Ensure that your measurement tools are reliable and valid. Collect data systematically and consistently across all groups. Be diligent in recording your data to prevent any errors.
Once data collection is complete, prepare your data for analysis. This includes checking for missing values, outliers, and errors. Clean your data to ensure it is ready for ANOVA. Coding your variables appropriately is also essential; for instance, assigning numerical values to categorical variables can streamline the analysis process.
3. Performing ANOVA with Statistical Software
Several statistical software packages, including SPSS, R, and Python, can perform ANOVA. Here's a brief overview of how to conduct ANOVA using these tools:
SPSS
- Enter Data: Input your data into the SPSS data editor.
- Define Variables: Go to the Variable View and define your independent and dependent variables.
- Run ANOVA: Navigate to Analyze > Compare Means > One-Way ANOVA for a one-way ANOVA, or Analyze > General Linear Model > Univariate for more complex designs.
- Set Options: Choose the appropriate options for post-hoc tests and effect size if needed.
- Interpret Output: Review the ANOVA table for the F-value and p-value to determine significance.
R
- Load Data: Import your dataset using functions like read.csv() or read.table().
- Fit ANOVA Model: Use the aov() function for a one-way ANOVA or anova() for more complex designs. Example: model <- aov(dependent_variable ~ independent_variable, data = dataset).
- Summary: Generate a summary of the model using summary(model).
- Post-Hoc Tests: Conduct post-hoc tests using functions like TukeyHSD(model).
Python
- Load Libraries: Import necessary libraries like pandas, scipy.stats, and statsmodels.
- Load Data: Use pandas to read your data, e.g., data = pd.read_csv('yourfile.csv').
- Fit ANOVA Model: Use stats.f_oneway() for a one-way ANOVA or ols() from statsmodels for more complex designs.
- Interpret Results: Examine the output for F-values and p-values.
With Appinio, you can streamline the entire process of conducting ANOVA without the need for complex methodologies or software. Easily design experiments, collect reliable data, and perform detailed ANOVA analyses all within a single platform. This means you can focus more on interpreting your results and making data-driven decisions rather than getting bogged down by technical details.
Discover how simple and efficient it can be to gain actionable insights and elevate your research!
4. Interpreting Results
After performing ANOVA, interpreting the results correctly is crucial:
- F-Statistic: This value indicates the ratio of between-group variance to within-group variance. A higher F-value suggests a more significant difference between groups.
- P-Value: This value helps determine the statistical significance. A p-value less than 0.05 typically indicates significant differences between groups.
- Post-Hoc Tests: If your ANOVA results are significant, post-hoc tests (like Tukey's HSD) can identify which specific groups differ from each other.
- Effect Size: Consider calculating the effect size to understand the magnitude of the differences, not just their significance. Standard measures include eta-squared and Cohen's d.
5. Reporting Results
Presenting your ANOVA results clearly and accurately is essential. Include the following in your report:
- Descriptive Statistics: Mean and standard deviation for each group.
- ANOVA Table: F-value, degrees of freedom, and p-value.
- Post-Hoc Test Results: Detailed results of any post-hoc analyses.
- Interpretation: A clear interpretation of the findings, including any practical or theoretical implications.
By following these steps, you can confidently conduct ANOVA, ensuring that your results are accurate and meaningful. Whether you're using SPSS, R, or Python, the principles remain the same: a robust design, meticulous data preparation, and thorough analysis and interpretation.
ANOVA vs. Other Statistical Tests
Choosing a suitable statistical test is crucial for accurate analysis and meaningful results. ANOVA is a powerful tool, but understanding how it compares to other statistical tests will help you make the best choice for your data.
ANOVA vs. T-Test
The t-test is another widely used statistical test, primarily for comparing the means of two groups. Here's how ANOVA and t-test differ and when to use each:
Number of Groups
- T-Test: Ideal for comparing the means of two groups. There are two types of t-tests: independent (for two separate groups) and paired (for two related groups).
- ANOVA: Designed to compare the means of three or more groups. It can handle more complex experimental designs with multiple groups and factors.
Example
Consider a study comparing the effects of two diets on weight loss. A t-test is suitable here since there are only two groups. However, if you introduce a third diet, ANOVA becomes the appropriate choice.
Assumptions
Both tests share similar assumptions, including normality, homogeneity of variances, and independence. If these assumptions are violated, consider using non-parametric alternatives like the Mann-Whitney U test for the t-test and the Kruskal-Wallis test for ANOVA.
ANOVA vs. Regression Analysis
Regression analysis explores the relationship between dependent and independent variables. It's versatile and can handle various types of data and relationships. Here's a comparison:
Focus
- ANOVA: Primarily focuses on comparing means across different groups and determining if those means are significantly different.
- Regression: Examines the relationship between dependent and independent variables, predicting the dependent variable based on one or more predictors.
Complexity
- ANOVA: Easier to use for simple comparisons and experimental designs with categorical independent variables.
- Regression: More flexible and can include both categorical and continuous variables, interaction effects, and polynomial terms to model complex relationships.
Example
Suppose you're studying the impact of education level and work experience on salary. Regression analysis allows you to include both factors and their interaction, providing a detailed model of how they influence salary.
ANOVA vs. Chi-Square Test
The chi-square test is used for categorical data to assess the association between variables. Here's how it compares to ANOVA:
Data Type
- ANOVA: Used for continuous data where you're interested in comparing group means.
- Chi-Square Test: Suitable for categorical data, where you're examining the relationship or independence between categorical variables.
Example
If you want to compare the average scores of students in different schools, ANOVA is appropriate. However, if you're interested in whether the distribution of students' preferred study methods (e.g., online, in-person, hybrid) differs by school, the chi-square test is the right choice.
Assumptions
- ANOVA: Assumes normality, homogeneity of variances, and independence.
- Chi-Square Test: Assumes a sufficiently large sample size and that the data are categorical.
ANOVA vs. MANOVA
MANOVA (Multivariate ANOVA) is an extension of ANOVA that handles multiple dependent variables. Here's the distinction:
Number of Dependent Variables
- ANOVA: Used when there is one dependent variable.
- MANOVA: Suitable for analyzing multiple dependent variables simultaneously, considering the correlation between them.
Example
If you're evaluating the effect of a training program on employee performance, ANOVA is suitable for a single performance metric. However, if you want to assess performance, job satisfaction, and retention simultaneously, MANOVA provides a more comprehensive analysis.
Practical Considerations
When deciding between these tests, consider the following:
- Research Question: Clearly define what you're trying to discover. Are you comparing means, exploring relationships, or examining associations?
- Data Type: Ensure your data matches the requirements of the test (continuous vs. categorical).
- Assumptions: Check if your data meet the assumptions of the test. If not, look for robust or non-parametric alternatives.
- Complexity: Choose a test that matches your statistical knowledge and the complexity of your data.
Understanding the differences between ANOVA and other statistical tests allows you to choose the most appropriate method for your analysis. This ensures accurate, reliable, and meaningful results, ultimately leading to better-informed decisions and insights.
Conclusion for ANOVA
ANOVA is an essential tool in the statistician's toolkit, providing a robust method for comparing multiple groups and understanding the variability within data. By partitioning variance into meaningful components, ANOVA helps us determine whether observed differences in group means are statistically significant or merely the result of random chance. This guide has explored the foundational concepts, mathematical underpinnings, various types of ANOVA, and the importance of meeting assumptions for accurate results. Whether you're using one-way, two-way, or multivariate ANOVA, the principles remain the same: a rigorous approach to analyzing data and drawing reliable conclusions.
Understanding ANOVA's application in real-world scenarios, from clinical trials to market research, underscores its versatility and importance. Mastering ANOVA allows you to design better experiments, make more informed decisions, and contribute valuable insights to your field. This guide aims to demystify ANOVA and equip you with the knowledge and tools needed to apply this technique confidently. As you continue to work with data, remember that ANOVA is not just a statistical test but a gateway to deeper insights and more effective strategies based on empirical evidence.
How to Do an ANOVA Test in Minutes?
Appinio revolutionizes the way businesses conduct ANOVA by offering a real-time market research platform that makes gathering consumer insights quick, intuitive, and exciting. With Appinio, companies can effortlessly perform ANOVA to compare multiple groups and derive actionable insights without the hassle of lengthy, complicated, expensive research processes.
The platform's user-friendly interface and rapid data collection capabilities ensure that anyone, regardless of their research background, can conduct sophisticated statistical analyses like ANOVA and make data-driven decisions in minutes.
- Rapid Insights: From formulating questions to obtaining comprehensive insights, Appinio delivers results in under 23 minutes for up to 1,000 respondents, ensuring you have the data you need swiftly to make timely business decisions.
- Intuitive Platform: Designed for ease of use, Appinio's platform allows anyone to conduct thorough market research and ANOVA without needing advanced research expertise or a PhD. The intuitive interface guides users through the process seamlessly.
- Global Reach and Precision: With the ability to define target groups from over 1,200 characteristics and survey respondents in more than 90 countries, Appinio ensures your research is both precise and globally representative, providing the breadth and depth of insights required to inform strategic decisions.
Get facts and figures 🧠
Want to see more data insights? Our free reports are just the right thing for you!