KANO Analysis: The Complete Guide
Appinio Research · 20.10.2022 · 11min read

Content
Creating products or services that will satisfy your customers' needs is the ultimate goal for any team. While numerous ideas may be available, it's important to prioritize the development of product/service features in a customer-centric way.
This involves answering two key questions:
- What features are necessary for my product/service?
- Which features contribute to the "wow" effect?
To effectively answer these questions, it's crucial to understand which features differentiate your product from those of your competitors, and not just basing it on gut instinct!
And this is exactly what the Kano methodology can help to accomplish.
In this article, we'll explore why and how to use the Kano method, using a simple example to illustrate its effectiveness.
What exactly is the KANO method?
Developed by Japanese Professor Noriaki Kano of the Tokyo University of Science in 1984, the KANO methodology recognizes that a product or service is more than just functionality.
Not every added feature has the same effect on customer satisfaction.
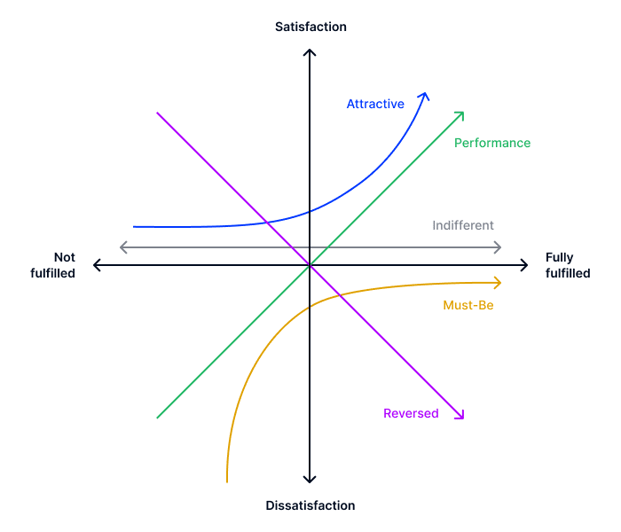
In order to evaluate features and properties, they are classified into five categories based on their effect on customer satisfaction:
-
Basic features (Musts)
They are always expected by customers and cause strong dissatisfaction if absent. However, customer satisfaction cannot be increased by their presence.
An example is the telephone function of a smartphone. -
Performance features (One-dimensional)
They have a linear relationship with customer satisfaction. The less pronounced they are, the less satisfied consumers are. They must match customer expectations and be of the same quality as those of competitor products.
An example is the resolution of a smartphone's camera. -
Attractive features (Attractive)
These are not expected by customers but are well-received if present.The absence of these features does not negatively affect customer satisfaction. They are used to differentiate from the competition.
An example is a free case delivered with a smartphone. -
Neutral / indifferent features (Irrelevant)
These do not add value for customers and do not affect satisfaction when present or absent.
An example is the number of ringtones on a smartphone. -
Reversed features (Reversed)
They are unwanted features that decrease customer satisfaction when present.
An example is the permanent tracking of a smartphone
The following chart of the Kano model of customer satisfaction illustrates the effect of the different categories on customer satisfaction when implemented or not.

However, assigning a feature to a category is not always clear-cut.
Different customer groups derive different benefits from different features, and the perceived benefit may differ depending on the target group. Therefore, a separate Kano analysis is necessary for different target groups.
Additionally, the evaluation of product features must consider time. Features that were exciting a few years ago may now be expected basic functions that are taken for granted by the target group.
How does the KANO method work (with Appinio) - A Step-by-Step Guide
Conducting a survey based on the KANO method is a simple and efficient process. Each feature is analyzed by asking a functional question and a dysfunctional question, each with the same answer options:
- Functional question: What do you think about product X/service X having feature Y?
- Dysfunctional question: What do you think about product X/service X not having function Y/function Y not having?
But conducting a KANO analysis with Appinio couldn't be easier.
Step 1: Get the survey ready
- Register for free on the Appinio platform.
- Browse among the example studies and templates, Define the features and the scenario you would like to test with or without their help.
Think you need extra help? Our experts are here for you, book a demo.
Step 2: Send your survey live
-
- Our research consultants will do a final check before your survey goes live.
-
- See the answers coming in! Our panel responds as soon as the survey is live.
- See the answers coming in! Our panel responds as soon as the survey is live.
Step 3: Analyze your data
-
-
Go to the Appinio interactive dashboard and start analyzing the data you collected.
-
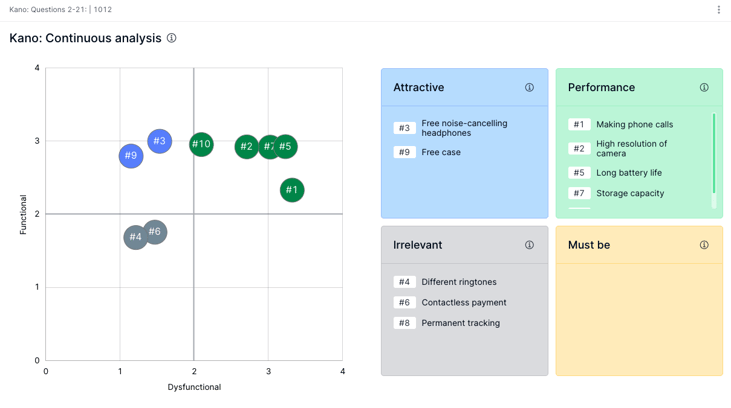
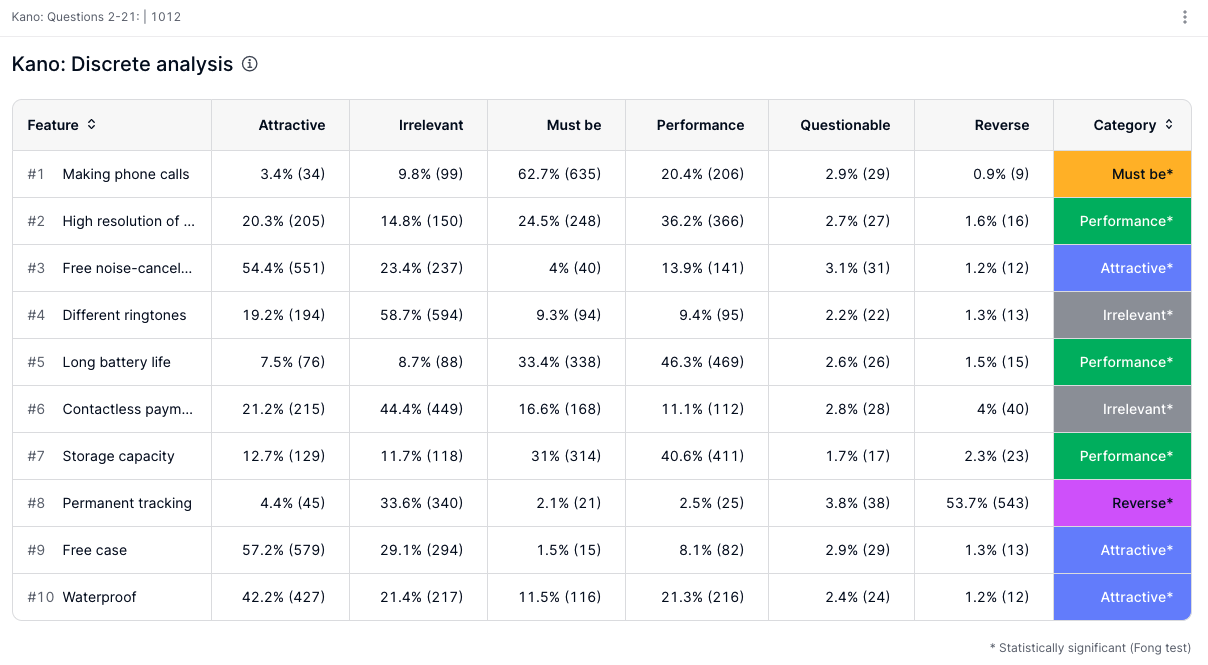
The results of the KANO survey are automatically calculated and visualised in two ways:
-
With a categorisation of the factors in tabular form ("discrete analysis"), and
-
In the form of a scatter diagram to take fine trends into account ("continuous analysis").
Accordingly, the results can be used immediately for decision-making.
-
-
Use the filter functions to understand how different groups perceive the features you tested.
-
Export your results to Excel, PPT or CSV at any time.
-


What are the advantages and disadvantages of the Kano method?
As many other methods, the KANO analysis has advantages and disadvantages.
Advantages
- The Kano method offers an efficient and straightforward way to identify customers' needs and desires, whether in the digital or non-digital space.
- It can be applied at any stage of a product's life cycle, making it a versatile tool to evaluate and prioritize product features.
- The Kano method helps to simplify the evaluation of product-market fit by allowing companies to set the right priorities early in the product's life cycle.
- For product managers, the Kano analysis is a helpful tool to create a product roadmap that aligns with customer needs.
- It is particularly useful in evaluating new product ideas, potential improvements, and determining how certain product features differentiate from the competition.
Disadvantages
- One of the main drawbacks of the Kano method is that potential features must be known beforehand. This requires various analyses of the market and customers, such as competitor analysis and customer interviews, to determine potential features.
- If many features are to be tested, surveys may become lengthy and tiring for the respondents. Therefore, careful consideration of the number and complexity of features included in the survey is necessary.
Conclusion for KANO method
In conclusion, the Kano method is a powerful tool for identifying customers' needs and desires, evaluating and prioritizing product features, and creating a roadmap for a product.
Its versatility allows it to be applied to any stage of a product's life cycle, and its benefits are especially helpful for product managers seeking to improve their products' market fit.
However, it is important to note that the Kano method is not suitable for generating new ideas for potential features, but rather for evaluating them once they have been identified through other means such as market and customer analysis.
Overall, the Kano method is a valuable addition to any market research toolkit and can lead to more informed and effective decision-making.
KANO Analysis explained
-
The key features in a KANO analysis include basic (must-haves), performance, excitement, insignificant, and reverse (negative add-ons) factors, which are used to assess customer satisfaction and prioritize product development efforts.
-
Advantages of the KANO model include:- Very versatile and applicable in every phase of the product life cycle.- It efficiently and simply identifies desires and requirements for a product or service.- It can be used in the development phase to focus on the most relevant factors.
-
The KANO model addresses the needs of businesses to identify and prioritize product features that lead to higher customer satisfaction, which ultimately helps in retaining customers and gaining a competitive advantage in the market.
-
The quality elements of the KANO model are used as a synonym of the five key features and describe the same categories of customer satisfaction.
Interested in running your own study?
In our dashboard, you will find questionnaire templates that you can customize and get the insights you need to bring your brand to the next level.
Get facts and figures 🧠
Want to see more data insights? Our free reports are just the right thing for you!


