Appinio Research · 30.05.2024 · 29min read
Have you ever wondered why a small number of problems seem to cause the majority of issues in your work or personal life? The answer might lie in the Pareto Principle, a powerful concept that helps identify and focus on the most significant factors affecting your outcomes. Based on this principle, Pareto Analysis is a simple yet effective tool for pinpointing the few critical problems or opportunities that will make the most significant impact. By understanding and applying Pareto Analysis, you can streamline processes, improve efficiency, and achieve better results in various fields, from business and healthcare to customer service and information technology.
This guide will take you through the essentials of Pareto Analysis, from its definition and historical background to practical applications and step-by-step instructions on constructing Pareto charts. Whether you're new to this concept or looking to deepen your knowledge, this guide will equip you with the insights and tools needed to make the most of Pareto Analysis in your daily activities.
What is Pareto Analysis?
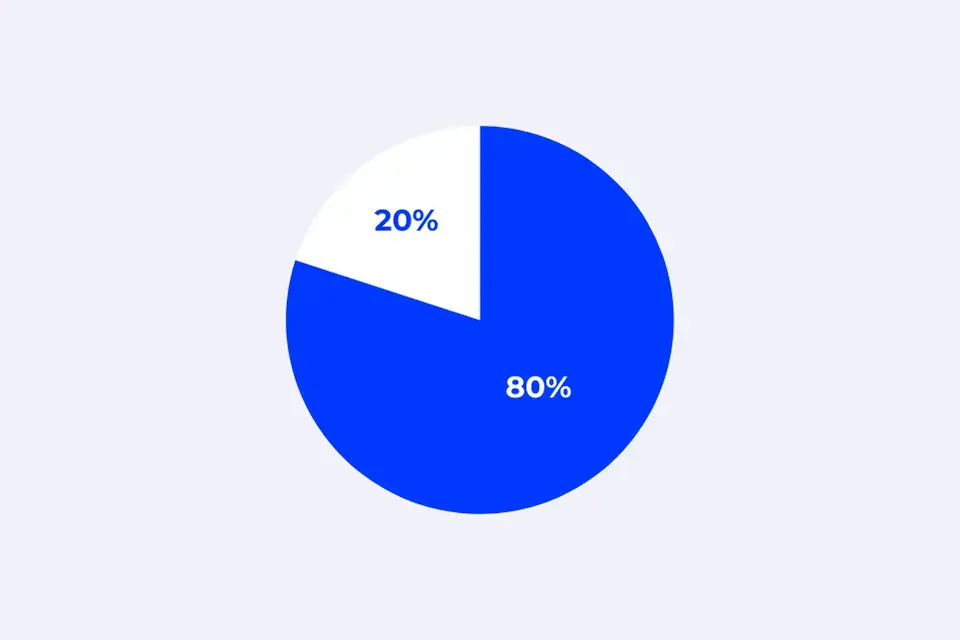
Pareto Analysis is a statistical technique in decision-making used to select a limited number of tasks that produce significant overall effects. This method is based on the Pareto Principle, also known as the 80/20 rule, which states that roughly 80% of effects come from 20% of causes. By applying Pareto Analysis, you can identify and focus on the "vital few" factors that will have the most substantial impact on your objectives.
The essence of Pareto Analysis lies in its ability to separate the significant from the insignificant. Whether you are dealing with quality control, business strategy, or resource allocation, this method helps you prioritize issues based on their relative importance. Doing so ensures that your efforts are concentrated on areas that will yield the highest returns.
Historical Background and Origin
The concept of Pareto Analysis is named after Vilfredo Pareto, an Italian economist and sociologist who first introduced the principle in the early 20th century. In 1906, Pareto observed that approximately 80% of the land in Italy was owned by 20% of the population. This observation led him to investigate the distribution of wealth and resources in other countries, where he found similar patterns.
Pareto's work laid the foundation for the development of the Pareto Principle, which was later popularized by quality management pioneer Joseph M. Juran. Juran recognized the broader applicability of Pareto's findings and incorporated the principle into his quality management practices. He coined the terms "vital few and trivial many" to describe the phenomenon where a small percentage of causes lead to a large percentage of effects.
Over time, Pareto Analysis has evolved into a widely used tool in various fields, including business, economics, healthcare, and engineering. Its application extends beyond wealth distribution to areas such as quality control, customer satisfaction, and project management, demonstrating its versatility and effectiveness.
Importance of Pareto Analysis in Various Fields
Pareto Analysis holds significant importance across various fields due to its ability to streamline processes, enhance decision-making, and improve overall outcomes. Here are some key reasons why Pareto Analysis is valuable in different domains:
- Quality Control: Pareto Analysis helps identify the most common defects or issues in manufacturing and production. By addressing these critical problems, companies can improve product quality and reduce waste.
- Business Strategy: In business, Pareto Analysis aids in identifying the most profitable products, services, or customer segments. This allows companies to focus their marketing and sales efforts on areas that will generate the highest returns.
- Healthcare: Pareto Analysis can be used to identify the most frequent causes of medical errors or patient complaints. Healthcare providers can improve patient safety and satisfaction by targeting these critical areas.
- Project Management: Project managers use Pareto Analysis to prioritize tasks and allocate resources effectively. By focusing on the most critical activities, they can ensure that projects are completed on time and within budget.
- Customer Service: In customer service, Pareto Analysis helps identify the most common complaints or issues customers face. By resolving these top concerns, companies can enhance customer satisfaction and loyalty.
- Supply Chain Management: Supply chain managers use Pareto Analysis to identify the most significant factors affecting inventory levels, delivery times, and costs. This enables them to optimize their supply chain operations and reduce inefficiencies.
- Human Resources: In HR, Pareto Analysis can be used to identify the most common reasons for employee turnover or dissatisfaction. By addressing these critical issues, organizations can improve employee retention and morale.
- Financial Management: Financial analysts use Pareto Analysis to identify the most significant sources of revenue or expenses. This helps in making informed decisions about budget allocation and cost reduction.
Pareto Analysis is a powerful tool that can be applied to various fields to improve decision-making, efficiency, and effectiveness. By focusing on the most critical factors, organizations can achieve better outcomes and drive continuous improvement.
Understanding the Pareto Principle
The Pareto Principle, or the 80/20 rule, is a foundational concept in understanding how to prioritize effectively. This principle, introduced by Vilfredo Pareto, helps identify the critical few factors that have the most significant impact on outcomes. By focusing on these key factors, you can optimize resources, enhance productivity, and achieve better results.
What is the 80/20 Rule?
The 80/20 rule suggests that in many situations, approximately 80% of the effects come from 20% of the causes. This uneven distribution can be observed across various domains, indicating that a minority of inputs or efforts often lead to the majority of outcomes. The principle is not a strict mathematical law but rather a general observation that highlights the imbalance between inputs and outputs.
For instance, consider a business scenario where 20% of the products generate 80% of the revenue. This doesn't mean the exact percentages will always be 80 and 20, but the principle suggests that focusing on the top-performing products can yield substantial benefits.
Examples of the Pareto Principle in Real Life
The Pareto Principle can be seen in numerous real-world scenarios, demonstrating its broad applicability:
- Business: A small percentage of customers (20%) might account for a significant portion (80%) of a company's sales. By identifying and catering to these key customers, businesses can maximize their revenue and customer satisfaction.
- Healthcare: In a hospital setting, a minority of patients (20%) often require the majority (80%) of healthcare resources. Understanding this distribution can help hospitals manage resources more effectively and improve patient care.
- Software Development: A few lines of code (20%) can cause most bugs (80%). By focusing on critical code sections, developers can significantly enhance software reliability.
- Personal Productivity: A small number of tasks (20%) might contribute to the majority (80%) of your productivity. Identifying and prioritizing these tasks can help you achieve more with less effort.
- Wealth Distribution: Historically, Pareto observed that 20% of the population owned 80% of the land in Italy. This observation has been extended to modern economic contexts where wealth distribution often follows a similar pattern.
Pareto Principle vs. Pareto Analysis
While the Pareto Principle provides a conceptual understanding of the imbalance between causes and effects, Pareto Analysis is a more structured method to apply this principle in practical scenarios. Here's how they differ:
- Pareto Principle: This is a general observation or rule of thumb that highlights the significant imbalance between inputs and outputs. It provides a lens through which you can view and understand the distribution of efforts and results.
- Pareto Analysis: This is a systematic approach that uses the Pareto Principle to identify and prioritize the most critical factors in a given situation. It involves collecting data, categorizing causes, and creating a Pareto chart to visually represent the distribution of impacts.
In essence, the Pareto Principle is a theoretical concept, while Pareto Analysis is a practical tool that helps you apply this concept to make informed decisions and improve efficiency. By understanding and utilizing both, you can better manage resources, solve problems, and achieve your goals more effectively.
How to Conduct a Pareto Analysis?
Pareto Analysis is a systematic process involving several key steps. By following these steps, you can effectively identify and prioritize the factors that will have the most significant impact on your outcomes. This process helps you make informed decisions and focus your efforts where they matter the most.
1. Identify the Problem or Opportunity
The first step in conducting a Pareto Analysis is to clearly define the problem or opportunity you are addressing. This involves understanding the context and scope of the issue. Ask yourself questions like:
- What specific problem are we trying to solve?
- What opportunity are we looking to capitalize on?
- Who are the stakeholders involved?
- What are the expected outcomes or goals?
For example, if you are a manager in a manufacturing company facing a high rate of defective products, your problem is the defects. Conversely, if you're a sales manager looking to increase revenue, your opportunity might be identifying top-performing sales strategies.
2. Data Collection and Categorization
Once the problem or opportunity is clearly defined, the next step is to gather relevant data. This involves collecting quantitative data that can be measured and analyzed. It's crucial to ensure that the data is accurate, reliable, and sufficient to draw meaningful conclusions.
Sources of Data
Data can come from various sources, depending on the context of the problem or opportunity. Some common sources include:
- Sales Records: For identifying top-selling products or high-revenue customers.
- Customer Feedback: For understanding common complaints or issues.
- Operational Logs: For pinpointing frequent breakdowns or defects in manufacturing.
- Surveys and Questionnaires: For gathering insights from stakeholders or customers.
Categorizing Data
After collecting the data, the next step is categorizing it into meaningful groups. This involves identifying the different causes or factors contributing to the problem or opportunity. Categories should be mutually exclusive and collectively exhaustive, ensuring all potential causes are covered without overlap.
For example, when analyzing defects in manufacturing, categories might include machine malfunctions, human error, material quality, and environmental factors.
Accurate and comprehensive data collection is pivotal in Pareto Analysis, but it can often be a time-consuming and complex task. Leveraging modern tools for this step can significantly streamline the process. Appinio offers an innovative solution for gathering real-time consumer insights swiftly and efficiently. With its intuitive platform, you can collect and categorize data in minutes, ensuring you have reliable and up-to-date information to drive your Pareto Analysis. This seamless integration of advanced data collection tools not only saves time but also enhances the accuracy of your analysis, enabling more effective decision-making.
Ready to experience the power of Appinio? Book a demo today and see how it can transform your business strategy!
3. Rank the Causes or Issues
With the data categorized, the next step is to rank these causes or issues based on their impact. This involves quantifying the effects of each category and determining which ones contribute the most to the problem or opportunity.
Quantitative Ranking
To rank the causes, you can use a simple count or frequency of occurrences. Alternatively, you might consider the financial impact or severity of each category. Assign a numerical value to each category to facilitate comparison.
For example, if you have categorized customer complaints, you might rank them by the number of complaints per category or by the financial cost associated with resolving each type of complaint.
Prioritization
Once ranked, prioritize the categories based on their impact. Focus on the top-ranking causes or issues that contribute the most to the problem. This prioritization helps in allocating resources effectively to address the most critical factors first.
4. Create the Pareto Chart
The final step in conducting a Pareto Analysis is to create a Pareto chart. This visual tool helps illustrate the relative importance of different causes or issues and aids decision-making.
Constructing the Chart
To create a Pareto chart, follow these steps:
- List Categories: Arrange the categories in descending order based on their impact or frequency.
- Calculate Cumulative Totals: Compute the cumulative total for each category to show the cumulative impact.
- Draw Axes: On the horizontal axis, list the categories. On the left vertical axis, plot the frequency or impact of each category. On the right vertical axis, plot the cumulative percentage.
- Bar and Line Graph: Draw bars to represent the impact or frequency of each category. Then, plot a line graph showing the cumulative percentage.
Interpreting the Chart
A well-constructed Pareto chart helps visualize which categories have the most significant impact. The chart typically shows that a few categories (the "vital few") contribute to the majority of the impact, while the remaining categories (the "trivial many") have a lesser impact. This visualization aids in focusing efforts on the most critical areas.
By following these steps, you can conduct a Pareto Analysis, identify key factors impacting your outcomes, and make data-driven decisions to address problems or capitalize on opportunities.
How to Make a Pareto Chart?
Creating a Pareto chart is a crucial part of the Pareto Analysis process. This visual tool illustrates the relative importance of different causes or issues and guides you in prioritizing your efforts. Let's explore the tools you can use, the steps to create a Pareto chart, and how to interpret it effectively.
Tools and Software for Creating Pareto Charts
Numerous tools and software can help you create Pareto charts efficiently. Depending on your preference and the complexity of your data, you can choose from simple spreadsheet programs to more advanced statistical software.
- Appinio: A real-time market research platform that simplifies data collection and analysis. Appinio enables quick and efficient creation of Pareto charts by providing accurate and up-to-date consumer insights. It's an excellent choice for businesses looking to make fast, data-driven decisions.
- Microsoft Excel: One of the most popular tools for creating Pareto charts. Excel provides built-in charting features and templates, making constructing and customizing Pareto charts easy.
- Google Sheets: A cloud-based alternative to Excel, Google Sheets offers similar functionalities for creating Pareto charts. It's ideal for collaborative work and accessible from any device with internet access.
- Minitab: A powerful statistical analysis tool that offers advanced features for creating and analyzing Pareto charts. It's widely used in quality control and Six Sigma projects.
- IBM SPSS: Another robust statistical software that provides comprehensive tools for data analysis and visualization, including Pareto charts.
- Lucidchart: A web-based diagramming tool that allows you to create Pareto charts and other types of diagrams. It's user-friendly and integrates with various platforms like Google Drive and Microsoft Office.
- Tableau: An advanced data visualization tool that can handle large datasets and create interactive Pareto charts. It's ideal for detailed data analysis and presentations.
How to Create a Pareto Chart?
 Creating a Pareto chart involves several steps, from organizing your data to drawing and customizing the chart. Here's a detailed guide to help you through the process:
Organize Your Data
- List Categories: Start by listing all the categories or causes you've identified.
- Record Frequencies: Note the frequency or impact (e.g., cost, time, defects) associated with each category.
Calculate Cumulative Totals
- Sort Data: Arrange the categories in descending order based on their frequency or impact.
- Cumulative Sum: Calculate the cumulative sum for each category to show the cumulative impact.
Draw the Pareto Chart
- Set Up Axes: On the horizontal axis, list the categories in descending order. On the left vertical axis, plot the frequency or impact of each category. On the right vertical axis, plot the cumulative percentage.
- Draw Bars: For each category, draw a bar representing its frequency or impact.
- Plot Line Graph: Add a line graph showing the cumulative percentage, starting from the first category and progressing through the others.
Customize and Label
- Title and Labels: Add a title, label the axes, and include data labels on the bars for clarity.
- Color Coding: Use different colors for the bars and line graph to distinguish them easily.
Interpreting the Pareto Chart
Interpreting a Pareto chart involves analyzing the visual representation to identify the most significant factors. Here's how to effectively interpret the chart:
Identify the Vital Few
The Pareto chart will typically show that a small number of categories (the "vital few") contribute to the majority of the problem or impact. These are the categories that appear on the left side of the chart and have the tallest bars.
Analyze the Cumulative Line
The cumulative line graph helps you see the aggregate impact of the categories. It should rise steeply at first, indicating that the initial categories contribute the most. The line flattens as you move along the horizontal axis, showing that the remaining categories have a lesser impact.
Determine Priorities
Examining the Pareto chart can help you determine which categories to prioritize. Focus on the vital few categories contributing to 80% of the impact. Addressing these first will yield the most significant improvements.
Example Analysis
Suppose you have a Pareto chart showing reasons for customer complaints. If the chart indicates that "delivery delays" and "product defects" are the top two causes, addressing these issues first will likely reduce the majority of complaints. The cumulative line might show that these two categories alone account for over 60% of complaints, emphasizing their importance.
Constructing and interpreting a Pareto chart allows you to visualize the most critical factors affecting your outcomes. This visual tool is invaluable for prioritizing actions, allocating resources efficiently, and driving meaningful improvements in various contexts, from business to personal productivity.
Pareto Analysis Applications
Pareto Analysis is a versatile tool that finds applications across various fields. By focusing on the most critical issues, this method helps improve efficiency, effectiveness, and overall performance. Here are some detailed applications of Pareto Analysis in different domains.
Quality Control and Management
Pareto Analysis is widely used in quality control and management to identify the most significant factors affecting product quality. Organizations can substantially improve their processes and products by focusing on these key factors.
- Identifying Defects: In manufacturing, Pareto Analysis helps identify the most common defects in products. By addressing these defects first, companies can significantly reduce the overall defect rate.
- Process Improvement: Quality managers can use Pareto charts to highlight the most frequent causes of process inefficiencies. This allows them to prioritize process improvements that will have the greatest impact.
- Resource Allocation: By pinpointing the most critical quality issues, resources can be allocated more effectively to address these problems, leading to better utilization of time and money.
Business and Economics
In business and economics, Pareto Analysis helps organizations focus on the most profitable aspects of their operations. This can lead to increased efficiency, higher profits, and better strategic planning.
- Sales Optimization: Businesses can use Pareto Analysis to identify the top-performing products or services that generate the most revenue. Focusing on these products can boost overall sales and profitability.
- Customer Segmentation: By analyzing customer data, companies can identify the most valuable customers. Tailoring marketing efforts and customer service to these key customers can enhance customer satisfaction and loyalty.
- Cost Reduction: Pareto Analysis can highlight a business's primary sources of costs. By targeting these high-cost areas, companies can implement cost-saving measures that significantly impact their bottom line.
Healthcare and Medicine
Pareto Analysis is used in healthcare to improve patient care, optimize resource allocation, and enhance overall healthcare outcomes.
- Patient Care: Hospitals can use Pareto Analysis to identify the most common medical errors or complications. Addressing these issues can lead to improved patient safety and care quality.
- Resource Management: By analyzing patient data, healthcare providers can determine which treatments or procedures consume the most resources. This helps optimize resource allocation to ensure the efficient use of medical supplies and personnel.
- Public Health: Public health officials can use Pareto Analysis to identify the most prevalent health issues within a population. Targeting these issues with focused interventions can lead to better health outcomes on a larger scale.
Information Technology
In the field of information technology, Pareto Analysis helps identify and address the most significant issues that impact system performance and user satisfaction.
- Bug Tracking: Software developers can use Pareto Analysis to identify the most frequent and severe bugs in their applications. Prioritizing the resolution of these bugs can improve software stability and user experience.
- System Performance: IT teams can analyze system performance data to identify the primary causes of slowdowns or failures. Addressing these critical issues can lead to more reliable and efficient systems.
- User Support: IT support teams can analyze support tickets and user feedback to determine the most common issues users face. Focusing on these issues can improve support services and user satisfaction.
Advantages of Pareto Analysis
Pareto Analysis offers numerous benefits, making it a valuable tool for decision-making and problem-solving in various fields. Here are some key advantages of using Pareto Analysis:
- Focus on Critical Issues: By identifying the most significant factors contributing to a problem, Pareto Analysis helps you concentrate your efforts on the areas that will have the greatest impact. This targeted approach ensures that your resources are used efficiently.
- Data-Driven Decision Making: Pareto Analysis relies on actual data to identify key issues, which minimizes guesswork and subjective decision-making. This data-driven approach increases the accuracy and reliability of your decisions.
- Resource Optimization: By highlighting the most critical issues, Pareto Analysis enables you to allocate resources more effectively. This ensures that time, money, and effort are directed towards solving the most pressing problems.
- Improvement in Overall Performance: Addressing the most significant issues first can lead to substantial improvements in overall performance. Whether in business, healthcare, or any other field, focusing on the critical few factors can enhance outcomes significantly.
- Simplicity and Ease of Use: Pareto Analysis is straightforward and easy to understand, making it accessible to many users. The process of identifying key factors and visualizing them using Pareto charts is intuitive and does not require advanced statistical knowledge.
- Versatility: Pareto Analysis can be applied in various contexts, from manufacturing and quality control to customer service and healthcare. Its versatility makes it a valuable tool across different industries and scenarios.
- Visualization: The Pareto chart provides a clear and visual representation of the most significant factors. This makes it easier to communicate findings and priorities to stakeholders, facilitating better understanding and collaboration.
- Encourages Continuous Improvement: By regularly conducting Pareto Analysis, organizations can continually identify new issues and opportunities for improvement. This ongoing process helps maintain high standards and fosters a culture of continuous improvement.
Pareto Analysis Limitations
While Pareto Analysis offers many benefits, it also has some limitations you should be aware of.
- Dependence on Accurate Data: The effectiveness of Pareto Analysis depends on the accuracy and reliability of the data collected. Inaccurate or incomplete data can lead to misleading results and poor decision-making.
- Potential Oversimplification: Pareto Analysis focuses on identifying the most significant factors but may oversimplify complex problems. Some issues may have multiple contributing factors that are interrelated, which this analysis might not fully capture.
- Not Suitable for All Problems: Pareto Analysis is most effective for identifying and prioritizing issues that can be quantified. It may not be as useful for qualitative problems or those that do not have clear, measurable factors.
- Static Nature: Pareto Analysis provides a snapshot of the current situation based on historical data. It does not account for future changes or trends that may impact the identified factors.
- Bias in Data Collection: The process of data collection and categorization can introduce bias, especially if the categories are not well-defined or if subjective judgment is involved. This bias can affect the accuracy of the analysis.
- May Ignore Minor Issues: While focusing on the critical few factors, Pareto Analysis may overlook minor issues that could become significant over time if not addressed. These minor issues can accumulate and lead to larger problems.
- Time and Resource Intensive: Conducting a thorough Pareto Analysis requires time and effort to collect, categorize, and analyze data. For organizations with limited resources, this process can be challenging.
- Misinterpretation of Results: Without proper understanding, there is a risk of misinterpreting the results of a Pareto Analysis. It's essential to accurately interpret the Pareto chart and understand the implications of the identified factors.
- Limited to Past Data: Pareto Analysis relies on historical data, which may not always accurately predict future outcomes. Changes in the environment, market conditions, or other external factors can alter the relevance of past data.
By being aware of these limitations, you can better understand the context in which Pareto Analysis is most effective and take steps to mitigate potential drawbacks. Despite its limitations, Pareto Analysis remains a powerful tool for prioritizing and addressing the most critical factors impacting your outcomes.
Conclusion for Pareto Analysis
Pareto Analysis is a remarkably effective tool for identifying the most significant factors that impact your outcomes, allowing you to focus on what truly matters. By applying the Pareto Principle, you can streamline your efforts and resources toward addressing the "vital few" issues that will yield the highest returns. Whether you are in manufacturing, healthcare, business, or any other field, the ability to prioritize effectively is crucial. The steps to conducting a Pareto Analysis—identifying the problem, collecting and categorizing data, ranking the issues, and creating a Pareto chart—are straightforward and can be implemented with various tools and software available today. This systematic approach not only simplifies decision-making but also enhances overall efficiency and productivity.
Understanding the advantages and limitations of Pareto Analysis ensures you use it appropriately and effectively. While it helps focus on the most impactful problems, it's important to recognize that not all issues can be quantified and that the analysis is based on historical data, which may not always predict future trends accurately. Despite these limitations, Pareto Analysis remains an invaluable method for continuous improvement and resource optimization. By regularly applying this technique, you can maintain high standards and drive significant improvements in your processes and outcomes. As you integrate Pareto Analysis into your toolkit, you'll find it an indispensable ally in achieving your goals and overcoming challenges with greater precision and effectiveness.
How to Conduct Pareto Analysis in Minutes?
Appinio is a real-time market research platform that empowers companies to gather consumer insights swiftly, enabling data-driven decisions with ease. By utilizing Appinio, organizations can conduct Pareto Analysis in minutes, streamlining the process of identifying and prioritizing key issues.
This platform simplifies the research process by handling the technical and analytical heavy lifting, allowing businesses to concentrate on making informed, impactful decisions. With Appinio, market research becomes exciting, intuitive, and seamlessly integrated into daily operations.
- Rapid Insights: Obtain consumer insights and conduct Pareto Analysis in less than 23 minutes, with responses from 1,000 respondents, helping businesses make quick, informed decisions.
- User-Friendly Interface: No advanced degrees required. Appinio’s intuitive platform is designed for ease of use, allowing anyone to perform comprehensive market research.
- Global Reach and Targeting: Access over 1,200 characteristics to define your target group and survey respondents in over 90 countries, ensuring you get relevant and precise data.